TL;DR Quick Answers
How to calculate recipe plate cost
Recipe plate cost equals the sum of every ingredient's edible portion cost at the recipe's portion size, plus a 5 to 10 percent Q factor for the small extras your spreadsheet won't catch on its own. The five-step calculation working chefs use:
Convert each vendor price into a per-ounce or per-gram cost that matches your recipe's units.
Adjust for yield using EP Cost equals AP Cost divided by Yield Percentage.
Multiply each EP cost by the portion size the recipe actually calls for.
Sum the ingredient lines for your raw plate cost.
Add a Q factor of 5 to 10 percent to cover salt, oil, garnishes, bread service, and small kitchen waste.
Divide that final plate cost by your target food cost percentage to back into a defensible menu price. Most full-service operators target 28 to 35 percent.
Top Takeaways
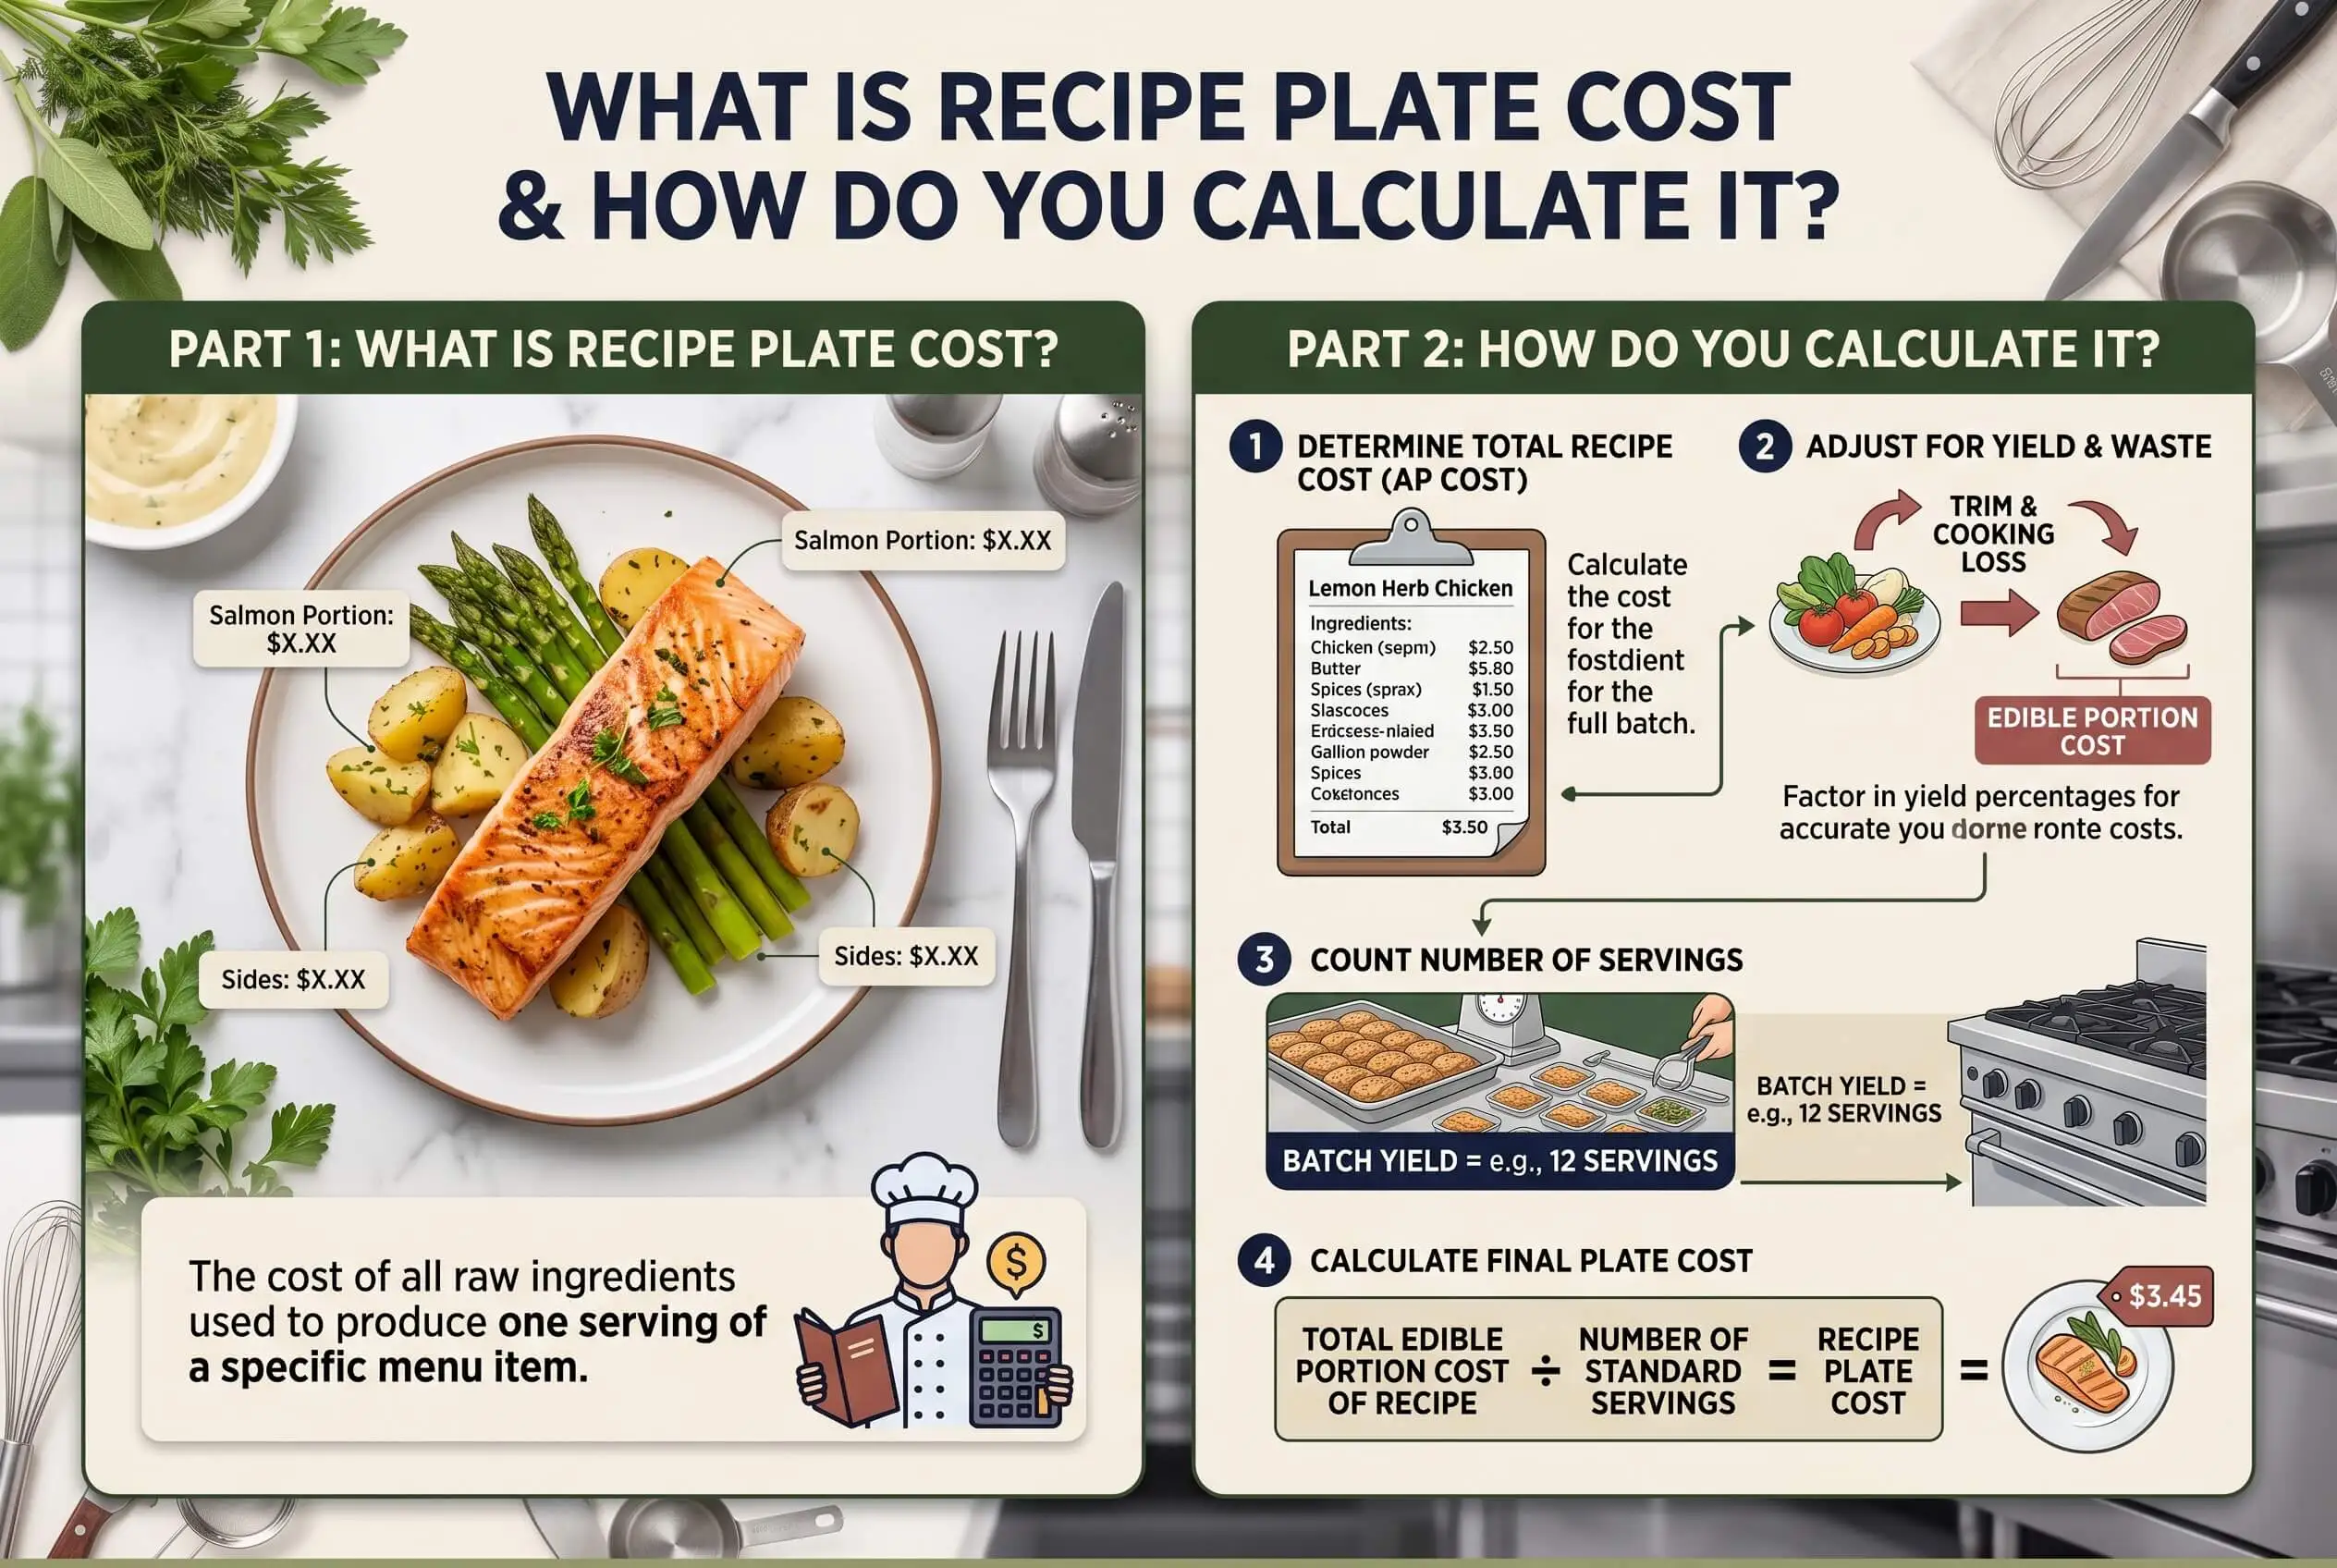
Plate cost is the per-portion ingredient cost of a single menu item, built from a standardized recipe with specific quantities and a defined portion size.
Always cost recipes against Edible Portion (EP) numbers, not As Purchased (AP) numbers, by dividing AP cost by the yield percentage for each ingredient.
Add a Q factor of 5 to 10 percent to the raw plate cost to cover salt, oil, garnishes, condiments, and small kitchen waste.
Food cost percentage equals plate cost divided by menu price, multiplied by 100, and most full-service operators target between 28 and 35 percent.
Recost recipes any time a key ingredient price moves more than 5 percent, and at minimum once a month for your top-selling dishes.
How To Calculate Recipe Plate Cost Step By Step
Start With A Standardized Recipe
Every plate cost calculation starts with a standardized recipe. The recipe locks the ingredient list, the quantities, and the portion size, so the dish leaving the line at lunch matches the dish leaving at dinner, and Saturday's plate matches Tuesday's. A food recipe costing template gives you a consistent place to record those details before the math starts. Write it with exact weights and volumes. Skip “a pinch” or “to taste.” Specify the brand and grade you're costing against, because two purveyors will quote chicken breast at different price points and the cheaper option usually has a lower yield or different cut quality that shows up when the cooks trim it down. Note the final portion size as a hard number, whether that's eight ounces of pasta or six ounces of protein. Without that baseline, you're costing a moving target every time somebody on the team runs the math.
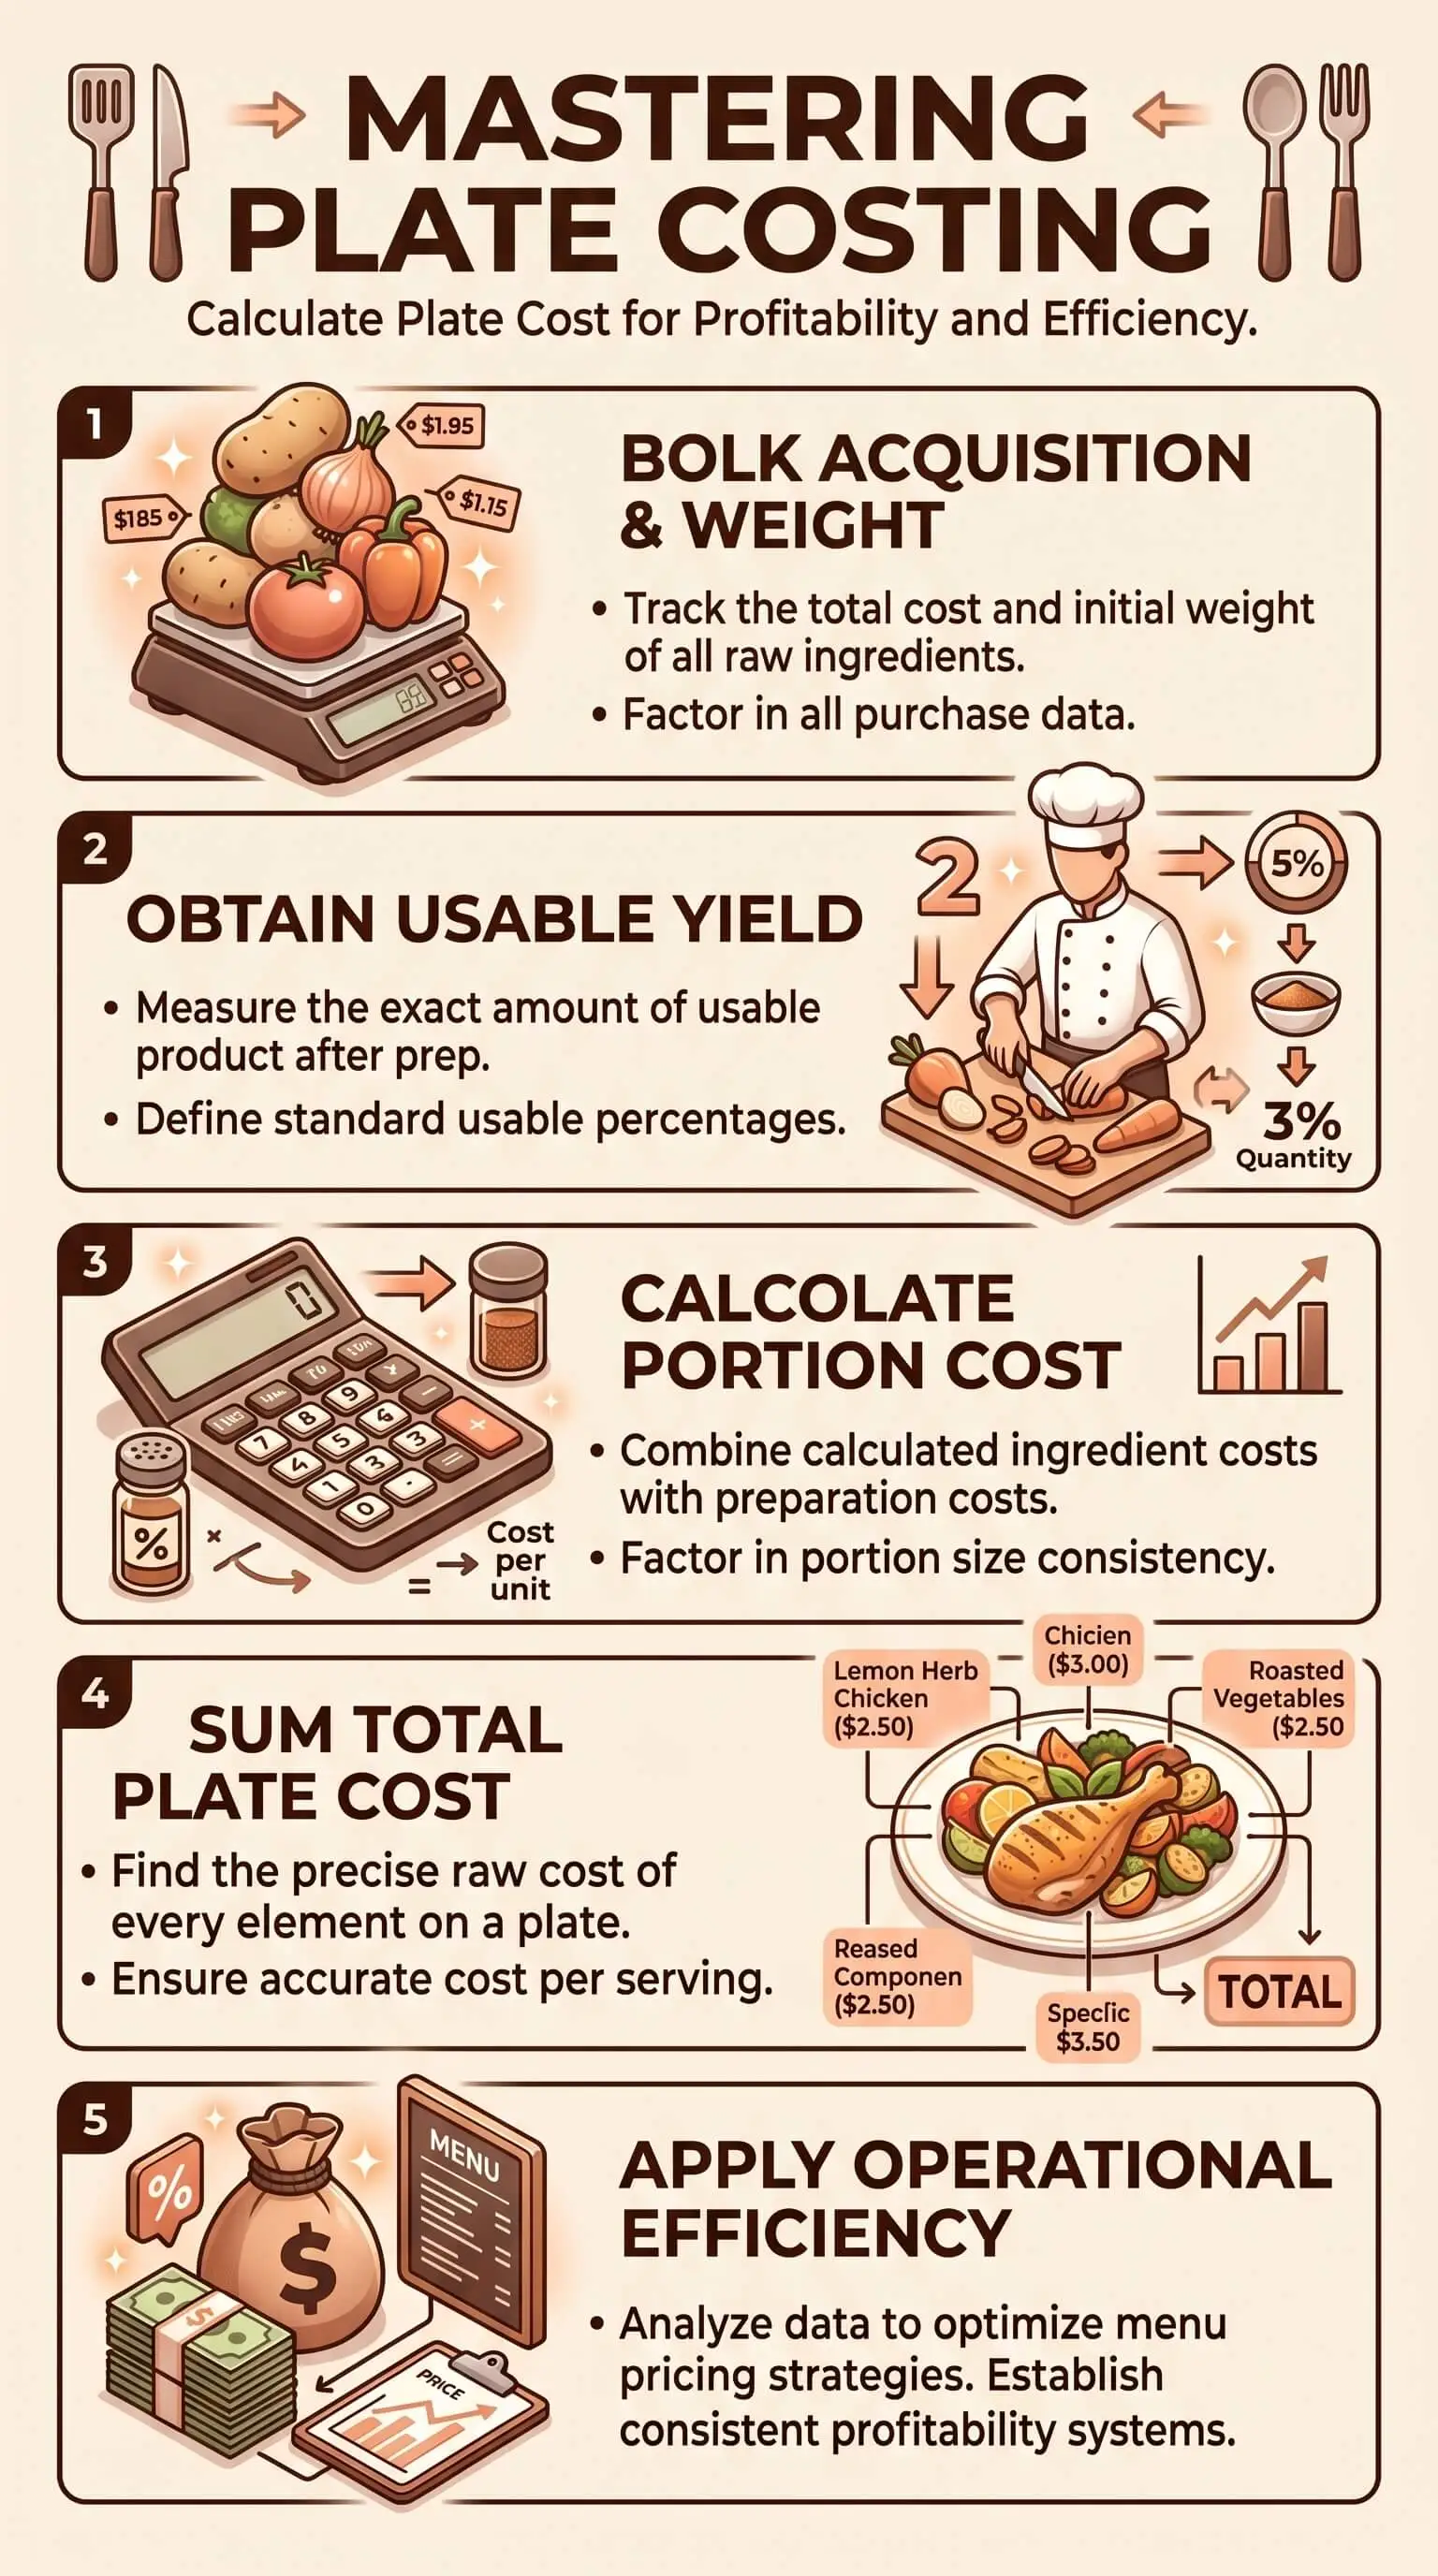
Convert Vendor Pricing Into A Usable Unit Cost
Your invoices show case prices. Your recipes call for ounces or grams. Getting from one to the other is the first piece of arithmetic in any plate cost calculation. Take the case price, divide by the number of usable units in the case, then divide again into the smallest unit your recipe actually calls for. A 25-pound bag of flour at $18 works out to 72 cents per pound, or about 4.5 cents per ounce. A 6.25-pound beef tenderloin invoiced at $232 lands at $2.32 per ounce. Once those numbers exist, keep them consistent across the whole recipe. If butter is priced by the ounce in one line, every other ingredient should be priced by the ounce too. The single biggest reason a plate cost comes out wrong on the first pass is sloppy unit conversion that nobody on the team caught before the recipe got cost.
Adjust For Yield: EP Cost vs AP Cost
Here's where most operators leave money on the table. The price on your invoice is the As Purchased cost, which is what you paid before any trim or peel or cooking loss. The number that actually belongs in your plate cost is the Edible Portion cost — what hits the plate after the waste hits the trash. The formula is straightforward:
EP Cost equals AP Cost divided by Yield Percentage.
A chicken breast that costs $4.50 per pound at the invoice line and yields 85 percent after trimming actually costs you $5.29 per usable pound. Russet potatoes typically yield about 81 percent after peeling. A whole salmon side might yield closer to 60 percent once you account for pin-bone removal and trim. The pattern holds across categories: the AP price always understates what the usable portion really costs. Skip this adjustment and you'll watch your theoretical plate cost run low while your actual food cost percentage runs high every month. Every chef who's worked a busy line has seen this gap open up, and yield is what closes it.
Calculate Each Ingredient's Portion Cost
With an EP cost in hand for every ingredient, the rest of the math is straightforward. Multiply each EP cost by the portion size the recipe actually calls for. Sum those ingredient lines and you have your raw plate cost.
Working example: a six-ounce roasted chicken breast plate with rice pilaf and seasonal vegetables.
Chicken breast, 6 oz at $0.33/oz EP: $1.98
Rice pilaf, 4 oz at $0.18/oz EP: $0.72
Seasonal vegetables, 3 oz at $0.41/oz EP: $1.23
Pan sauce, 1.5 oz at $0.55/oz EP: $0.83
Herb garnish, 0.25 oz at $1.20/oz EP: $0.30
Raw plate cost: $5.06. That's the number before you account for the small extras and waste every kitchen runs into but rarely captures on the recipe sheet. The next adjustment handles that.
Add A Q Factor For The Small Stuff
The Q factor is the percentage you add to raw plate cost to cover everything your recipe spreadsheet didn't capture but the kitchen still pays for. That covers salt, pepper, cooking oil, the butter wash on the bread service, garnishes, lemon wedges, the complimentary condiments at the table, and the inevitable mis-fires that get scraped into the bin. Another thing kitchens tend to forget is the oil used to saute proteins and the butter that gets tossed with vegetables at the pass. Both belong in the Q factor. Most full-service operators run a Q factor between 5 and 10 percent of raw plate cost, with concepts that include table bread and butter usually landing closer to 10. Apply 10 percent to the chicken plate above and the math becomes:
$5.06 plus ($5.06 multiplied by 0.10) equals $5.57.
That $5.57 is the true plate cost for the dish. Ignore the Q factor and every menu item on the board costs more to produce than the spreadsheet admits.
Translate Plate Cost Into A Menu Price
Plate cost is what the dish costs you to produce. Menu price is what the guest pays. The bridge between them is your target food cost percentage, which is the share of the menu price you've decided ingredient cost should account for. Two formulas do most of the work:
Food Cost Percent equals (Plate Cost divided by Menu Price) multiplied by 100.
Ideal Menu Price equals Plate Cost divided by Target Food Cost Percent.
The chicken plate at $5.57 plate cost, priced at $18.95 on the menu, runs a food cost of 29.4 percent, which sits comfortably inside the 28 to 35 percent range most full-service operators target. Working the same formula in reverse and a $5.57 plate cost against a 30 percent food cost target produces an ideal menu price of $18.57. Hit that target and the dish covers its ingredients with enough margin left to absorb labor, rent, utilities, and profit, while also supporting a smart brand extension strategy when new menu items are priced with the same discipline. Miss it and every cover becomes a small leak in the P&L. The plate cost tells you which side of the line you're sitting on, and the recosting cadence is what keeps you on the right side over time.
“Three decades behind the line taught us one thing about plate costing: if you're using as-purchased cost when you should be using edible portion cost, your food cost percentage will quietly creep up every month and you'll never figure out why. A 75 percent yield on a protein means your true ingredient cost is roughly 33 percent higher than the invoice line tells you. Cost recipes against EP. Always. The kitchens that hold their margins are the ones that don't skip that step.”
7 Essential Resources
Seven resources worth bookmarking for plate costing, yield management, and the operating data that drives menu pricing decisions in working kitchens.
Calculating Food Cost (The Culinary Pro): A working-chef walkthrough of plate cost, food cost percentage, and Q factor with a full Angus filet example. https://www.theculinarypro.com/calculating-food-cost
Inflation and Cost Pressures (National Restaurant Association): Industry-level data on how food, labor, and operating costs have moved since 2020 and what that means for menu pricing decisions. https://restaurant.org/research-and-media/research/inflation/
Food Prices and Spending (USDA Economic Research Service): Federal data on wholesale and retail food price trends, useful for anticipating where your ingredient costs are heading next quarter. https://www.ers.usda.gov/data-products/ag-and-food-statistics-charting-the-essentials/food-prices-and-spending
Food Cost Calculation Form (Chef's Resources): A free downloadable Excel template for tracking month-end inventory and calculating your overall food cost percentage. https://www.chefs-resources.com/kitchen-forms/food-cost-calculation/
How to Cost a Plate of Food (Toast): A practical, step-by-step plate cost guide with a worked burger-and-fries example and waste factor math. https://pos.toasttab.com/blog/on-the-line/calculate-plate-cost
How to Calculate Food Cost (meez): A modern operator's guide covering per-serving cost, Q factor application, and how to reverse-engineer a menu price from a target food cost percentage. https://www.getmeez.com/blog/how-to-calculate-food-cost
Menu and Recipe Pricing (Pennsylvania State University, Introduction to Food Production and Service): An academic chapter on menu pricing strategies, yield tests, and blended pricing methods used in foodservice education. https://psu.pb.unizin.org/hmd329/chapter/ch8/
3 Statistics
Three numbers that explain why disciplined plate costing matters more for restaurant survival in 2026 than at any point in the last decade.
32.4 percent. That's the median food and non-alcohol beverage cost as a percentage of sales among limited-service restaurants in 2024, according to the National Restaurant Association's 2025 Restaurant Operations Data Abstract. Full-service operators ran a median of 32.0 percent. (Source: National Restaurant Association)
82 percent. That's the share of restaurant operators who reported higher average food costs in 2025, with average food costs now more than 35 percent above pre-pandemic levels per the National Restaurant Association's 2026 State of the Industry report. (Source: Nation's Restaurant News coverage of NRA 2026 State of the Industry)
3.8 percent. That's how much higher the food-away-from-home Consumer Price Index ran in March 2026 compared to March 2025, according to the USDA Economic Research Service Food Price Outlook. Menu prices are still climbing faster than grocery prices. (Source: USDA Economic Research Service)
Final Thoughts And Opinion
A plate cost calculation done once and filed away is worth almost nothing in a working kitchen. The number stops being accurate the moment a vendor price moves or a supplier yield shifts, which is usually inside a month of when you ran the original math. Ingredient costs drift through the year as supplier quality changes, and dry spice yields can shift quietly when grinding, sifting, or portion habits change. Q factors quietly creep when portions go heavy-handed during a Friday dinner rush. The operators who hold their margins recost their top sellers every month, audit yields once a quarter, and won't let the gap between theoretical plate cost and actual food cost open past two points before they sit down with the team to figure out where it's coming from. Build the formula into a spreadsheet someone on your team will actually open every week. Cooks need portion specs as part of orientation, not as an afterthought. The simple, fast tools are the ones that survive service weeks. Complex systems usually get abandoned by month two. That's how plate cost becomes a habit the kitchen actually runs on.
Frequently Asked Questions
What is the formula for recipe plate cost?
Plate cost equals the sum of every ingredient's edible portion cost at the recipe's portion size, plus a 5 to 10 percent Q factor for small extras and kitchen waste. The result is the actual ingredient cost of one finished plate.
What is the difference between plate cost and food cost?
Plate cost is the ingredient cost of one specific menu item. Food cost is the total cost of all ingredients used over a defined period, usually expressed as a percentage of total food sales for that period.
How often should I recalculate plate cost?
Recost your top-selling dishes monthly and the rest of the menu quarterly. Any time a key ingredient price moves more than 5 percent, recost the affected recipes that same week so the menu price still hits your margin target.
Should labor be included in plate cost?
Traditionally no. Plate cost covers ingredients only. Some operators add a labor component to arrive at a fully loaded production cost per plate, but the pure plate cost number stays at the ingredient line.
What is a Q factor in plate costing?
A Q factor is a 5 to 10 percent uplift added to raw plate cost to cover salt, oil, garnishes, table condiments, complimentary bread, and small waste from over-portioning or mis-fires that the recipe spreadsheet doesn't capture line by line.
What is a good food cost percentage for a restaurant?
Most full-service operators target between 28 and 35 percent of menu price. Quick-service tends to run a tighter 28 to 32 percent, while fine-dining concepts often push the 32 to 35 percent end of the range because of premium ingredient sourcing and higher protein costs.
How do I calculate plate cost for a buffet or family-style meal?
Total the ingredient cost of the entire buffet spread, then divide by the number of guests served. That per-cover cost becomes the plate cost equivalent for pricing the buffet or setting the per-person family-style charge.
Why is my actual food cost higher than my theoretical plate cost?
Common causes are over-portioning, kitchen waste, spoilage, yield assumptions that don't match real prep loss, ingredient price drift between recosting cycles, and inventory shrinkage. Audit each in turn to find where the gap is opening up.
Bookmark, Share, And Keep Costing
Save this page for the next time you sit down with a recipe binder and a calculator. Send it to your sous chef or your pricing manager so the whole team's working from the same formulas. And if the math here saved you a headache, our archive has more operations content written for working operators, not for accountants, with the practical, growth-minded clarity a top marketing agency brings to every business decision.


